THANKS!
We appreciate your interest.
We will be in touch shortly.
Back to Planolitix
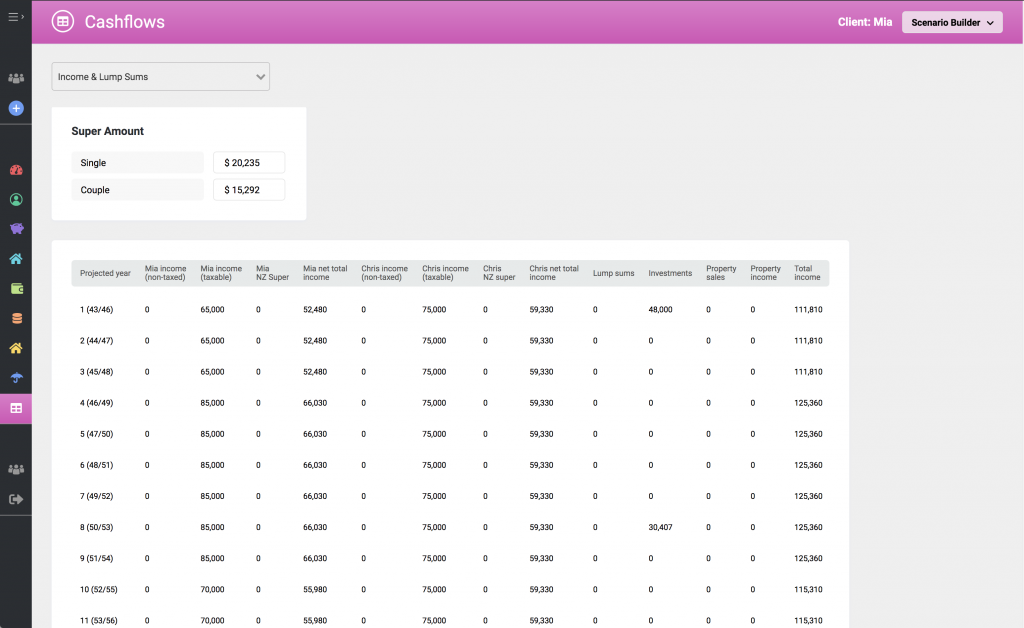
Cashflows in Detail
Planolitix has been designed to improve visibility and understanding of cashflow modelling. It creates clear, simple pictures that can be easily explained to your clients and included in a statement of advice to further support your recommendations.
Where you want more information, the tables section outlines the figures year-by-year, so you can see exactly what is influencing the graphs and where the numbers are coming from. It outlines, income, expenses, debt and investments, with the projected real return, capital gain, inflation and other figures that you can change.
Planolitix is designed to be as simple or complex as you need it to be. All the information is provided so you can see exactly how each model works.